RHEED Metrics#
%load_ext autoreload
%autoreload 2
import numpy as np
import matplotlib.pyplot as plt
from m3util.viz.style import set_style
from m3util.viz.printing import printer
from m3util.viz.layout import layout_fig
from sto_rheed.Viz import Viz
from sto_rheed.Dataset import RHEED_spot_Dataset, RHEED_parameter_dataset
from sto_rheed.Fit import NormalizeData
set_style("printing")
printing set for seaborn
1. Sample treated_213nm#
Loading the Dataset#
path = 'D:/STO_STO-Data/RHEED/STO_STO_Berkeley/STO_STO_test6_06292022-standard.h5'
D1_spot = RHEED_spot_Dataset(path, sample_name='treated_213nm')
D1_spot.viz_RHEED_spot(growth='growth_2', index=0, figsize=(2,4))
Fig. a: RHEED spot image for growth_2 at index 0.

Information of Gaussian fit parameters dataset#
path = 'D:/STO_STO-Data/RHEED/STO_STO_Berkeley/test6_gaussian_fit_parameters_all-04232023.h5'
D1_para = RHEED_parameter_dataset(path, camera_freq=500, sample_name='treated_213nm')
D1_para.viz_RHEED_parameter(growth='growth_2', spot='spot_2', index=10000)
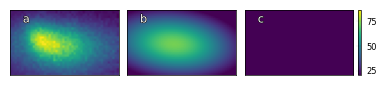
Fig. a: RHEED spot image, b: reconstructed RHEED spot image, c: difference between original and reconstructed image for growth_2 at index 10000.
img_sum=61247.00, img_max=87.00, img_mean=44.00
img_rec_sum=59368.68, img_rec_max=72.97, img_rec_mean=42.65
height=72.98, x=15.40, y=20.73, width_x=10.33, width_y_max=20.36
Plot of Gaussian fit parameters#
growth_list = ['growth_1', 'growth_2', 'growth_3', 'growth_4', 'growth_5', 'growth_6',
'growth_7', 'growth_8', 'growth_9', 'growth_10', 'growth_11', 'growth_12']
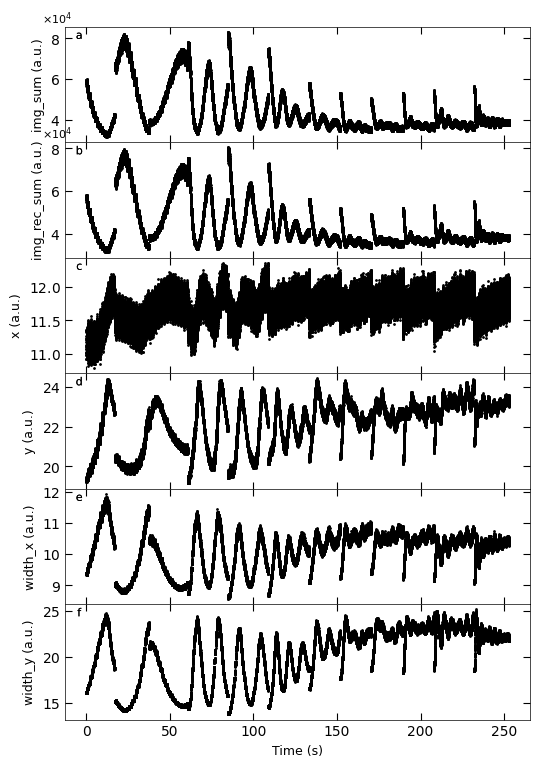
D1_para.viz_RHEED_parameter_trend(growth_list, spot='spot_2', metric_list=['img_sum', 'img_rec_sum', 'x', 'y', 'width_x', 'width_y'],
head_tail=(100,500), interval=200)
c:\users\yig319\lehigh university dropbox\yichen guo\predicting-pulsed-laser-deposition-srtio3-homoepitaxy-growth-dynamics-using-rheed\src\sto_rheed\Dataset.py:523: UserWarning: set_ticklabels() should only be used with a fixed number of ticks, i.e. after set_ticks() or using a FixedLocator.
  ax.set_xticklabels(['' for tick in ax.get_xticks()])
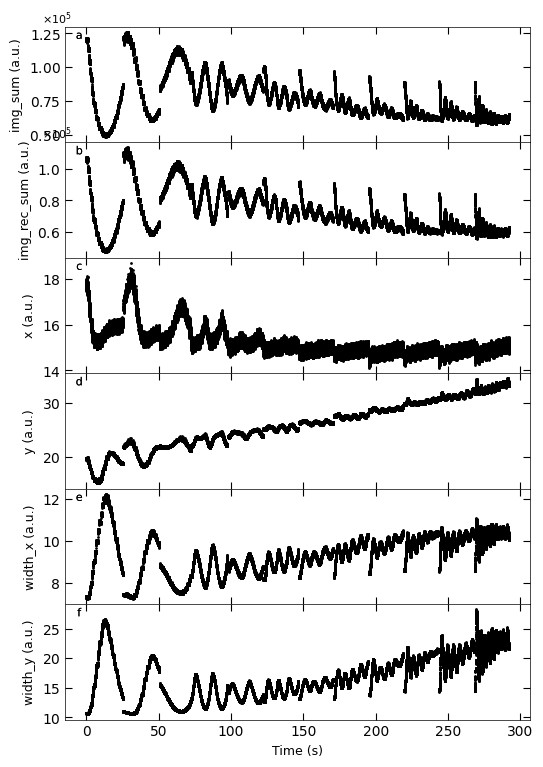
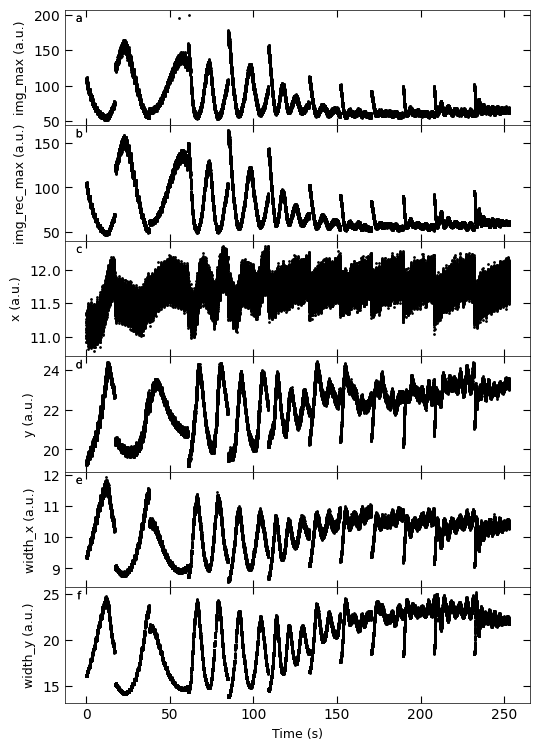
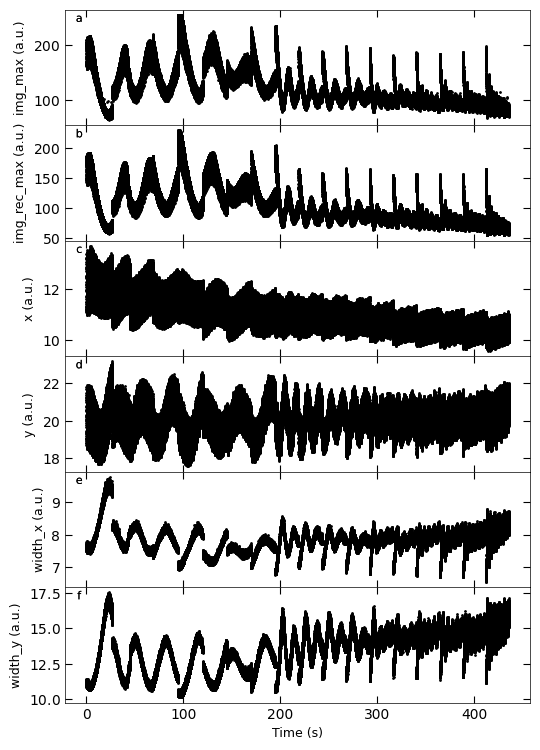
Gaussian fitted parameters in time: Fig. a: maximum intensity of original cropped RHEED spot, b: maximum intensity of resonstructed cropped RHEED spot, c: spot center in spot x coordinate, d: spot center in y coordinate, e: spot width in x coordinate, f: spot width in y coordinate.
growth_list = ['growth_1', 'growth_2', 'growth_3', 'growth_4', 'growth_5', 'growth_6',
               'growth_7', 'growth_8', 'growth_9', 'growth_10', 'growth_11', 'growth_12']
D1_para.viz_RHEED_parameter_trend(growth_list, spot='spot_2', head_tail=(100,500), interval=200)
c:\users\yig319\lehigh university dropbox\yichen guo\predicting-pulsed-laser-deposition-srtio3-homoepitaxy-growth-dynamics-using-rheed\src\sto_rheed\Dataset.py:523: UserWarning: set_ticklabels() should only be used with a fixed number of ticks, i.e. after set_ticks() or using a FixedLocator.
  ax.set_xticklabels(['' for tick in ax.get_xticks()])
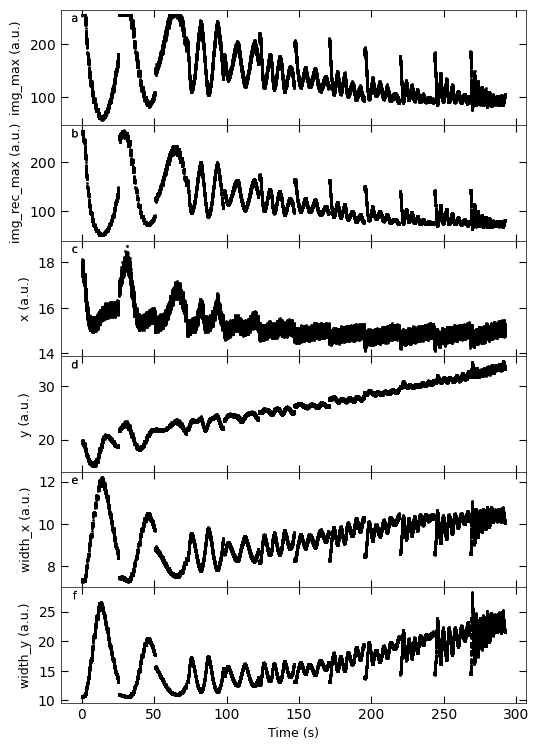
Gaussian fitted parameters in time: Fig. a: maximum intensity of original cropped RHEED spot, b: maximum intensity of resonstructed cropped RHEED spot, c: spot center in spot x coordinate, d: spot center in y coordinate, e: spot width in x coordinate, f: spot width in y coordinate.
2. Sample treated_81nm#
Loading the Dataset#
path = 'D:/STO_STO-Data/RHEED/STO_STO_Berkeley/STO_STO_test7_06292022-standard.h5'
D2_spot = RHEED_spot_Dataset(path, sample_name='treated_81nm')
D2_spot.viz_RHEED_spot(growth='growth_2', index=10, figsize=(2,3))
Fig. a: RHEED spot image for growth_2 at index 10.

Information of Gaussian fit parameters dataset#
path = 'D:/STO_STO-Data/RHEED/STO_STO_Berkeley/test7_gaussian_fit_parameters_all-04232023.h5'
D2_para = RHEED_parameter_dataset(path, camera_freq=500, sample_name='treated_81nm')
D2_para.viz_RHEED_parameter(growth='growth_2', spot='spot_2', index=10000)
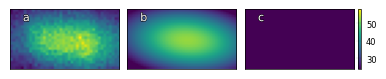
Fig. a: RHEED spot image, b: reconstructed RHEED spot image, c: difference between original and reconstructed image for growth_2 at index 10000.
img_sum=35031.00, img_max=58.00, img_mean=39.81
img_rec_sum=34451.97, img_rec_max=52.63, img_rec_mean=39.15
height=52.64, x=11.50, y=22.16, width_x=11.22, width_y_max=22.80
Plot of Gaussian fit parameters#
growth_list = ['growth_1', 'growth_2', 'growth_3', 'growth_4', 'growth_5', 'growth_6', 'growth_7', 'growth_8', 'growth_9', 'growth_10', 'growth_11', 'growth_12']
D2_para.viz_RHEED_parameter_trend(growth_list, spot='spot_2', metric_list=['img_sum', 'img_rec_sum', 'x', 'y', 'width_x', 'width_y'], )
c:\users\yig319\lehigh university dropbox\yichen guo\predicting-pulsed-laser-deposition-srtio3-homoepitaxy-growth-dynamics-using-rheed\src\sto_rheed\Dataset.py:523: UserWarning: set_ticklabels() should only be used with a fixed number of ticks, i.e. after set_ticks() or using a FixedLocator.
  ax.set_xticklabels(['' for tick in ax.get_xticks()])
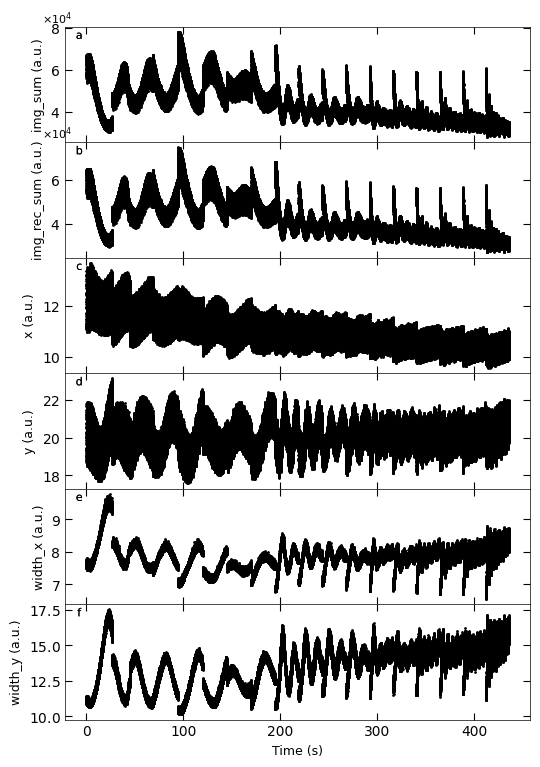
Gaussian fitted parameters in time: Fig. a: maximum intensity of original cropped RHEED spot, b: maximum intensity of resonstructed cropped RHEED spot, c: spot center in spot x coordinate, d: spot center in y coordinate, e: spot width in x coordinate, f: spot width in y coordinate.
growth_list = ['growth_1', 'growth_2', 'growth_3', 'growth_4', 'growth_5', 'growth_6', 'growth_7', 'growth_8', 'growth_9', 'growth_10', 'growth_11', 'growth_12']
D2_para.viz_RHEED_parameter_trend(growth_list, spot='spot_2')
c:\users\yig319\lehigh university dropbox\yichen guo\predicting-pulsed-laser-deposition-srtio3-homoepitaxy-growth-dynamics-using-rheed\src\sto_rheed\Dataset.py:523: UserWarning: set_ticklabels() should only be used with a fixed number of ticks, i.e. after set_ticks() or using a FixedLocator.
  ax.set_xticklabels(['' for tick in ax.get_xticks()])
Gaussian fitted parameters in time: Fig. a: maximum intensity of original cropped RHEED spot, b: maximum intensity of resonstructed cropped RHEED spot, c: spot center in spot x coordinate, d: spot center in y coordinate, e: spot width in x coordinate, f: spot width in y coordinate.
3. Sample untreated_162nm#
Loading the Dataset#
path = 'D:/STO_STO-Data/RHEED/STO_STO_Berkeley/STO_STO_test9_07142022-standard.h5'
D3_spot = RHEED_spot_Dataset(path, sample_name='untreated_162nm')
D3_spot.viz_RHEED_spot(growth='growth_2', index=0, figsize=(2,4))
Fig. a: RHEED spot image for growth_2 at index 0.

Information of Gaussian fit parameters dataset#
path = 'D:/STO_STO-Data/RHEED/STO_STO_Berkeley/test9_gaussian_fit_parameters_all-04232023.h5'
D3_para = RHEED_parameter_dataset(path, camera_freq=500, sample_name='untreated_162nm')
D3_para.viz_RHEED_parameter(growth='growth_2', spot='spot_2', index=100)
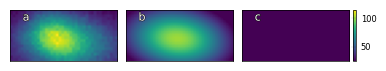
Fig. a: RHEED spot image, b: reconstructed RHEED spot image, c: difference between original and reconstructed image for growth_2 at index 100.
img_sum=45893.00, img_max=114.00, img_mean=60.39
img_rec_sum=44505.52, img_rec_max=101.14, img_rec_mean=58.56
height=101.29, x=10.95, y=19.21, width_x=8.27, width_y_max=13.94
Plot of Gaussian fit parameters#
growth_list = ['growth_1', 'growth_2', 'growth_3', 'growth_4', 'growth_5', 'growth_6', 'growth_7', 'growth_8', 'growth_9',
               'growth_10', 'growth_11', 'growth_12' , 'growth_13', 'growth_14', 'growth_15', 'growth_16', 'growth_17', 'growth_18']
D3_para.viz_RHEED_parameter_trend(growth_list, spot='spot_2', metric_list=['img_sum', 'img_rec_sum', 'x', 'y', 'width_x', 'width_y'])
c:\users\yig319\lehigh university dropbox\yichen guo\predicting-pulsed-laser-deposition-srtio3-homoepitaxy-growth-dynamics-using-rheed\src\sto_rheed\Dataset.py:523: UserWarning: set_ticklabels() should only be used with a fixed number of ticks, i.e. after set_ticks() or using a FixedLocator.
  ax.set_xticklabels(['' for tick in ax.get_xticks()])
Gaussian fitted parameters in time: Fig. a: maximum intensity of original cropped RHEED spot, b: maximum intensity of resonstructed cropped RHEED spot, c: spot center in spot x coordinate, d: spot center in y coordinate, e: spot width in x coordinate, f: spot width in y coordinate.
growth_list = ['growth_1', 'growth_2', 'growth_3', 'growth_4', 'growth_5', 'growth_6', 'growth_7', 'growth_8', 'growth_9',
               'growth_10', 'growth_11', 'growth_12' , 'growth_13', 'growth_14', 'growth_15', 'growth_16', 'growth_17', 'growth_18']
D3_para.viz_RHEED_parameter_trend(growth_list, spot='spot_2')
c:\users\yig319\lehigh university dropbox\yichen guo\predicting-pulsed-laser-deposition-srtio3-homoepitaxy-growth-dynamics-using-rheed\src\sto_rheed\Dataset.py:523: UserWarning: set_ticklabels() should only be used with a fixed number of ticks, i.e. after set_ticks() or using a FixedLocator.
  ax.set_xticklabels(['' for tick in ax.get_xticks()])
Gaussian fitted parameters in time: Fig. a: maximum intensity of original cropped RHEED spot, b: maximum intensity of resonstructed cropped RHEED spot, c: spot center in spot x coordinate, d: spot center in y coordinate, e: spot width in x coordinate, f: spot width in y coordinate.
Merged plot for RHEED intensity#
x_all_list, y_all_list = [], []

growth_list = ['growth_1', 'growth_2', 'growth_3', 'growth_4', 'growth_5', 'growth_6',
               'growth_7', 'growth_8', 'growth_9', 'growth_10', 'growth_11', 'growth_12']
x_all, y_all = D1_para.load_multiple_curves(growth_list=growth_list, spot='spot_2', metric='img_rec_sum')
x_all_list.append(x_all)
y_all_list.append(y_all)

growth_list = ['growth_1', 'growth_2', 'growth_3', 'growth_4', 'growth_5', 'growth_6', 'growth_7', 'growth_8', 'growth_9', 'growth_10', 'growth_11', 'growth_12']
x_all, y_all = D2_para.load_multiple_curves(growth_list=growth_list, spot='spot_2', metric='img_rec_sum')
x_all_list.append(x_all)
y_all_list.append(y_all)

growth_list = ['growth_1', 'growth_2', 'growth_3', 'growth_4', 'growth_5', 'growth_6', 'growth_7', 'growth_8', 'growth_9',
               'growth_10', 'growth_11', 'growth_12' , 'growth_13', 'growth_14', 'growth_15', 'growth_16', 'growth_17', 'growth_18']
x_all, y_all = D3_para.load_multiple_curves(growth_list=growth_list, spot='spot_2', metric='img_rec_sum')
x_all_list.append(x_all)
y_all_list.append(y_all)
color_blue = (44/255,123/255,182/255)
color_orange = (217/255,95/255,2/255)
color_purple = (117/255,112/255,179/255)
three_colors = [color_blue, color_orange, color_purple]
y_max_list, y_min_list = [], []

dashed_lines_x_1 = [0, 28, 65, 84, 96, 110, 122, 134, 140, 148, 159, 166, 173,
                    # 182, 187, 192, 197, 207.5, 212, 216.5, 222.5,
                    # 227, 231.5, 235, 238.5, 243, 247, 251.5, 255.5, 259.5, 264, 268, 272, 276,
                    ]
dashed_lines_x_2 = [23, 58, 74.5, 87, 99, 111, 118.5, 126.5, 135.5, 143, 151]
dashed_lines_x_3 = [1, 39, 66, 98, 130, 164, 198, 210, 222, 235, 248, 260, 272, 284, 297]
dashed_lines_x_list = [dashed_lines_x_1, dashed_lines_x_2, dashed_lines_x_3]
xlim_list = [(-8, 308), (-7, 262), (-12, 450)]
fig, axes = layout_fig(graph=3, mod=1, figsize=(8, 7), layout='tight')
for ax, x_all, y_all, color, dashed_lines_x, xlim in zip(axes, x_all_list, y_all_list, three_colors, dashed_lines_x_list, xlim_list):

    # normalize the intensity
    y_min_list.append(np.min(y_all))
    y_max_list.append(np.max(y_all))
    y_all = NormalizeData(y_all, lb=np.min(y_all), ub=np.max(y_all))

    ax.plot(x_all, y_all, color='black', linewidth=1)
    for x in dashed_lines_x:
        ax.plot([x, x], [np.min(y_all-0.05), np.max(y_all+0.05)], linestyle='--', linewidth=1, color=color)
    ax.set_xlim(xlim)
    ax.set_ylim(-0.1, 1.1)
    Viz.set_labels(ax, xlabel='Time (s)', ylabel='Intensity (a.u.)', yaxis_style='float')

plt.savefig('../Figures/1.Fit_RHEED_spot/summarized_spot_2_sum.png', dpi=600, bbox_inches='tight', transparent=True)
plt.show()

x_all_list, y_all_list = [], []

growth_list = ['growth_1', 'growth_2', 'growth_3']
x_all, y_all = D1_para.load_multiple_curves(growth_list=growth_list, spot='spot_2', metric='img_rec_sum')
y_all = y_all[(x_all>28) & (x_all<65)]
x_all = x_all[(x_all>28) & (x_all<65)]
x_all_list.append(x_all)
y_all_list.append(y_all)

growth_list = ['growth_1', 'growth_2', 'growth_3']
x_all, y_all = D2_para.load_multiple_curves(growth_list=growth_list, spot='spot_2', metric='img_rec_sum')
y_all = y_all[(x_all>23) & (x_all<60)]
x_all = x_all[(x_all>23) & (x_all<60)]
x_all_list.append(x_all)
y_all_list.append(y_all)

growth_list = ['growth_1', 'growth_2']
x_all, y_all = D3_para.load_multiple_curves(growth_list=growth_list, spot='spot_2', metric='img_rec_sum')
y_all = y_all[(x_all>1) & (x_all<39)]
x_all = x_all[(x_all>1) & (x_all<39)]
x_all_list.append(x_all)
y_all_list.append(y_all)
fig, axes = layout_fig(graph=3, mod=1, figsize=(3, 7), layout='tight')
for ax, x_all, y_all, y_min, y_max, color, dashed_lines_x in zip(axes, x_all_list, y_all_list, y_min_list, y_max_list, three_colors, dashed_lines_x_list):
    x_all = x_all - x_all[0]
    y_all = NormalizeData(y_all, lb=y_min, ub=y_max)

    ax.plot(x_all, y_all, color='black', linewidth=1)
    ax.set_xlim(-2, 40)
    ax.set_ylim(-0.1, 1.1)

    Viz.set_labels(ax, xlabel='Time (s)', ylabel='Intensity (a.u.)', yaxis_style='float')
plt.savefig('../Figures/1.Fit_RHEED_spot/summarized_single_unit_cell_growth.png', dpi=600, bbox_inches='tight', transparent=True)
plt.show()
